
Economic and Fiscal Profile: City of Kingston, New York
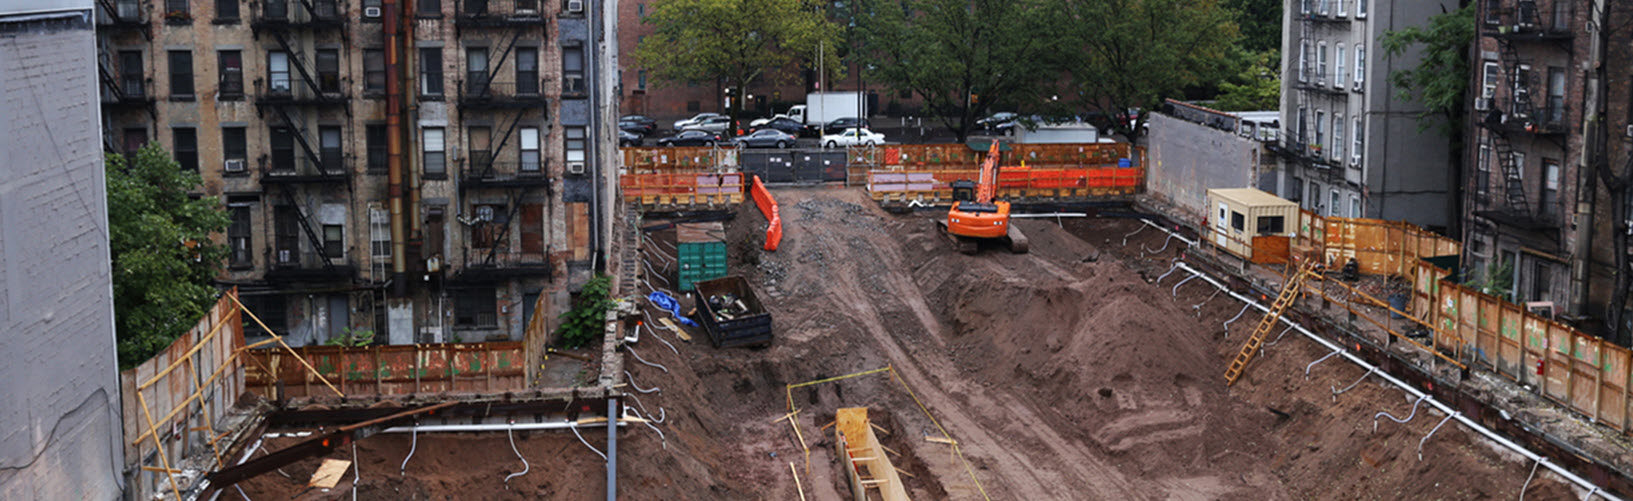
The City of Kingston is a destination for culture, arts and history located along the Hudson River in eastern Ulster County in the Mid-Hudson Region. Kingston is doing well by many fiscal measures. However, housing affordability has been a pressure point for city leaders, who have used multiple strategies including zoning reform, rent stabilization and property tax exemptions to address this challenge. Recently, the city has experienced budgetary pressures, as it has ramped up its debt issuance to make long-term investments in infrastructure and institutions. Prudent management of Kingston’s budget, as well as a continued focus on long-term planning, should ensure sustainable economic growth continues well into the city’s future.